
 EN

Getting started with remote machine monitoring
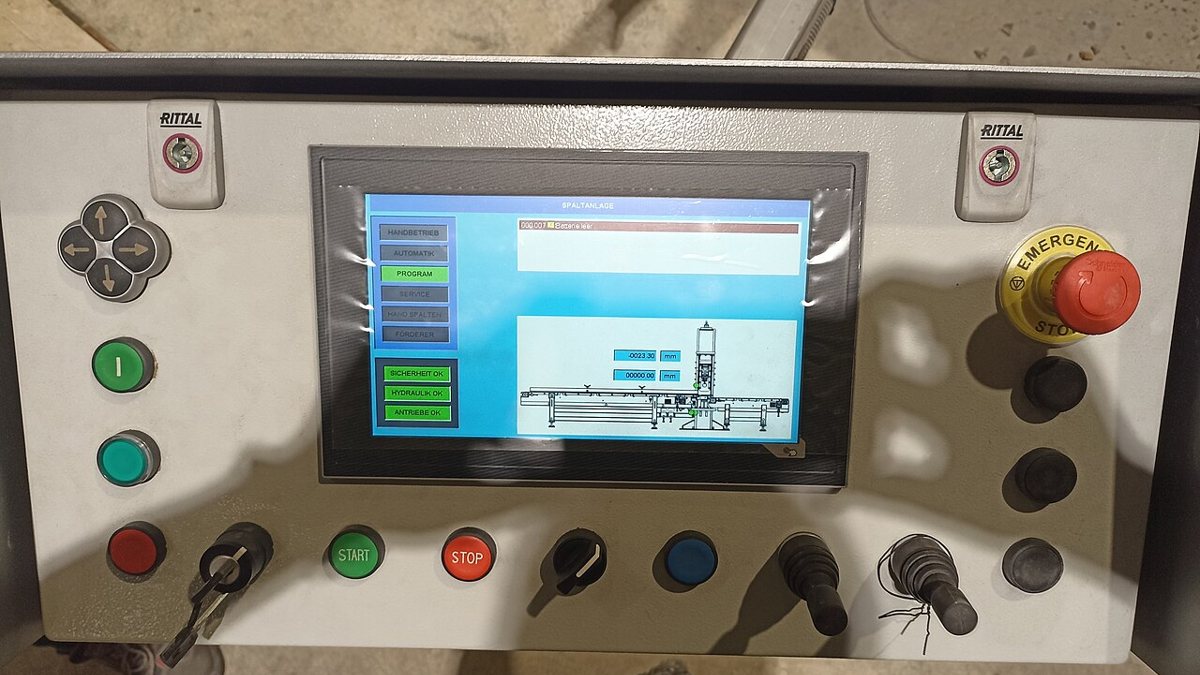
Many machines on the shop floor have run reliably for years but cannot tell you when they stopped, for how long, or that they are running hot. Remote monitoring does not require replacing the machine: you add sensors on the outside, bring the data to a small gateway and show it on a dashboard.
The four layers of a monitoring system
- Sensors: read physical signals from the machine.
- Gateway (edge device): collects, filters and buffers the data.
- Data transport: usually MQTT or Modbus TCP to a server.
- Storage and dashboard: charts, downtime reports and alerts.
Each layer can be swapped independently, so you are not locked into one vendor.
Step 1: Choose sensors that do not touch the control system
- Current sensor (clamp-on CT): clamps around one supply conductor. No current means the machine is off; low, steady current means idle; high current means running. This single signal is enough to calculate run time, idle time and cycle counts.
- Temperature sensors: on motors, gearboxes and hydraulic units to catch overheating early.
- Vibration sensors: on motor housings or bearing blocks to spot bearing wear and misalignment early.
- Pressure and flow sensors: to watch pneumatic and hydraulic lines and detect leaks.
Step 2: Read data from existing PLCs or power meters
If the machine already has a PLC, drive or power meter with an RS-485 or Ethernet port, you can often read data over Modbus RTU/TCP without changing the program. Read only: do not write to registers on a production machine unless the change has been tested and approved.
Step 3: Let the gateway work on site
A good gateway should:
- sample fast and send slow: summarize into a few values per minute instead of sending every sample;
- detect state changes locally so a stop is reported within seconds;
- buffer data when the network drops and forward it later, with no gaps in history;
- separate the shop-floor network from the office network to reduce security risk.
Step 4: Dashboard and alerts
Start with a few easy-to-read indicators:
- machine running, idle or stopped,
- run time per shift or day,
- temperature and current against thresholds,
- alerts by messaging app or email when a threshold is exceeded.
Do not try to show everything at once. Keep the dashboard simple so operators actually use it.
Safety and security notes
- Wiring inside electrical cabinets should be done by a qualified electrician with the machine isolated.
- Do not expose machines directly to the internet; use a VPN or an encrypted outbound connection.
- Set a separate password for each device and update firmware regularly.
Where to start
Pick one machine that often stops or is a bottleneck, add current and temperature sensors, and run it for a few weeks. Once you can see where the downtime goes, the case for the next machines makes itself.
Need help choosing sensors and a gateway?
Send us the machine type, the existing controllers and the parameters you want to track, and we will help you choose suitable sensors and a gateway.
Further reading: the retrofit guide for legacy machines from CrimsonEdge Systems and public documentation on MQTT and Modbus. This is an original write-up based on field experience.
Cover image: PLC displej by Quist161, licensed under CC BY-SA 4.0, cropped; via Wikimedia Commons.
